How to use Byteloom AI Dashboard Builder?
User Guide : Byteloom AI Dashboard Builder
Complete user guide for creating datasets, generating AI charts, and building powerful dashboards in your Odoo environment
What You'll Learn
Dataset Creation
Build custom datasets from your Odoo tables
AI Chart Generation
Let our LLM create intelligent visualizations
Chart Customization
Fine-tune charts with advanced editing tools
Dashboard Building
Assemble powerful, shareable dashboards
Requirements:
- Odoo Versions Supported: 16, 17, 18 (Enterprise or Community)
- Byteloom must be installed on your odoo
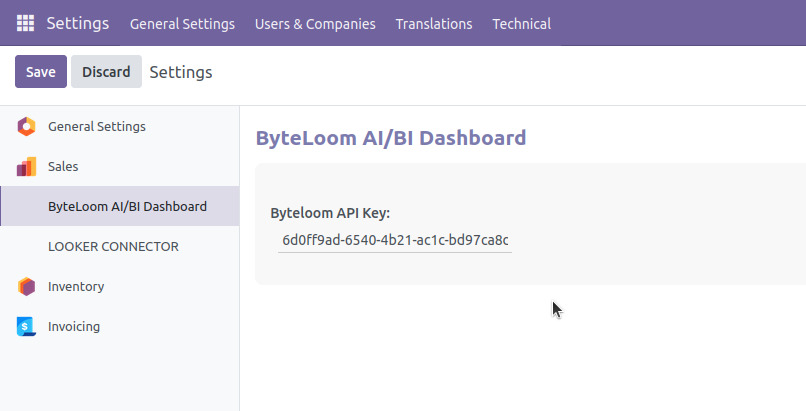
Licensing
Note: you must complete licensing before you can use the module.
- Send your Staging URL, Production URL, and the Invoice generated after purchase to hello@byteloom.ai.
- We will email you the licensing key.
- In Odoo, go to Settings > Apps > ByteLoom and enter the licensing key.
Watch Demo:
Create Dataset
Start by creating datasets to fine-tune the data fed to the AI for generating charts, KPIs, and dashboards. This foundational step ensures your visualizations are built on the right data structure.
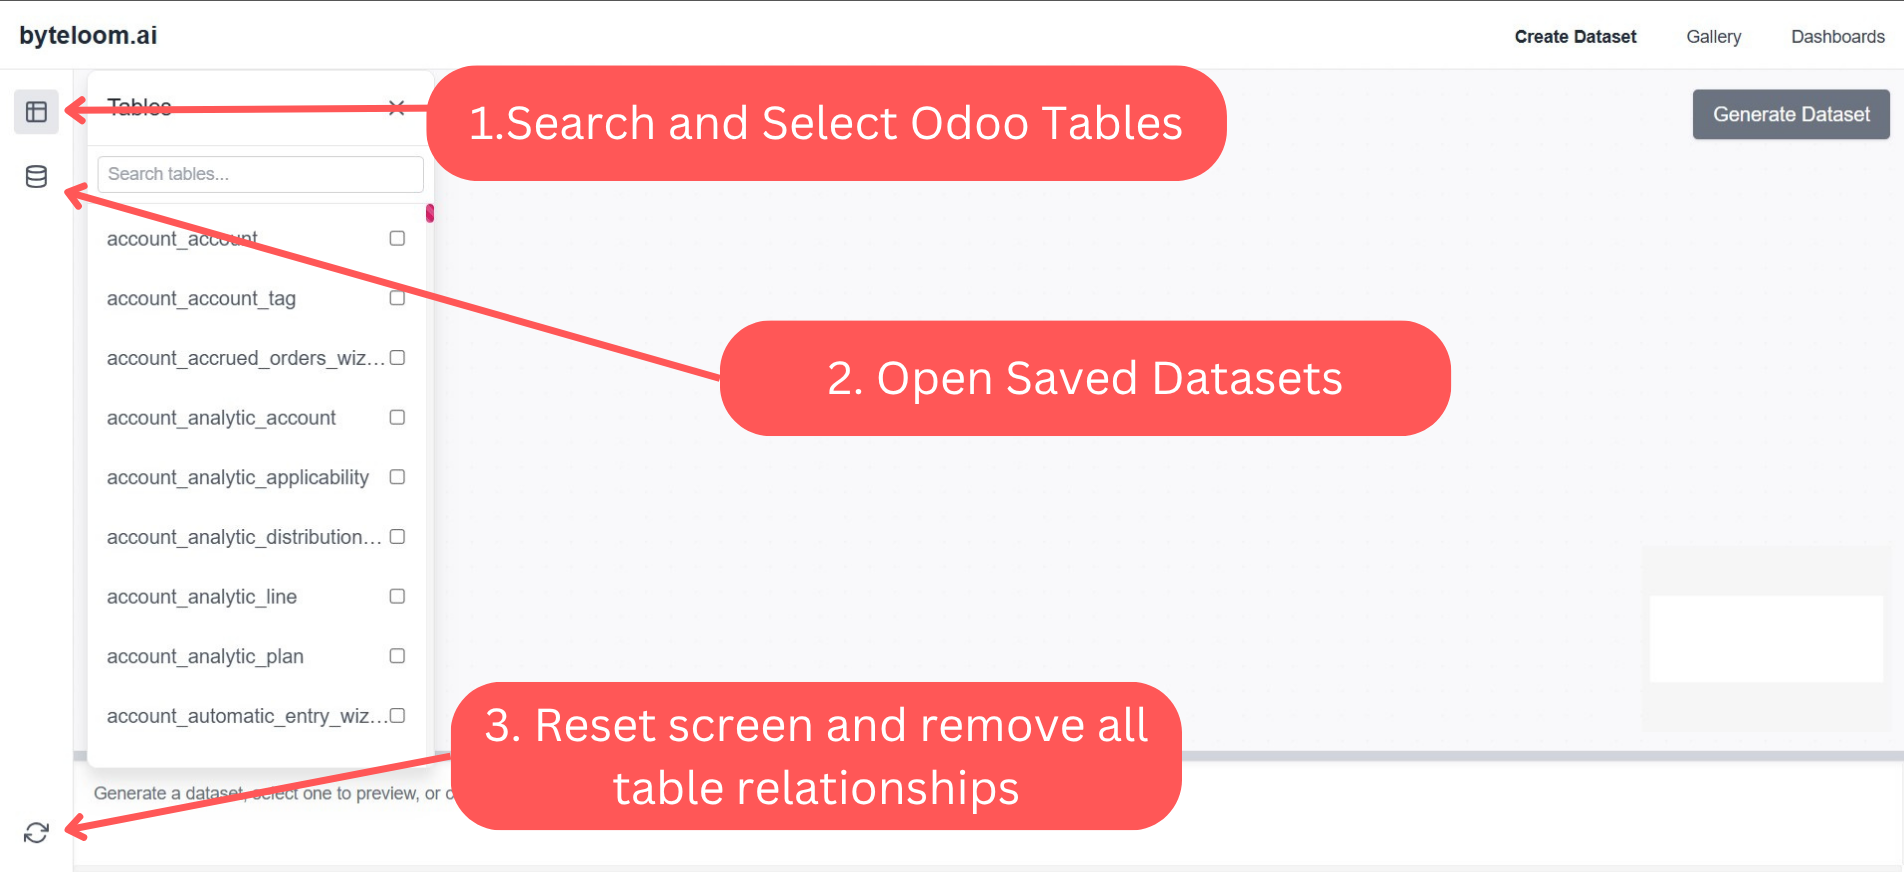
Search & Select Tables
Use the search functionality to find and select the Odoo tables you want to include in your dataset.
💡Tip: Choose tables that contain related data for better AI-generated insights
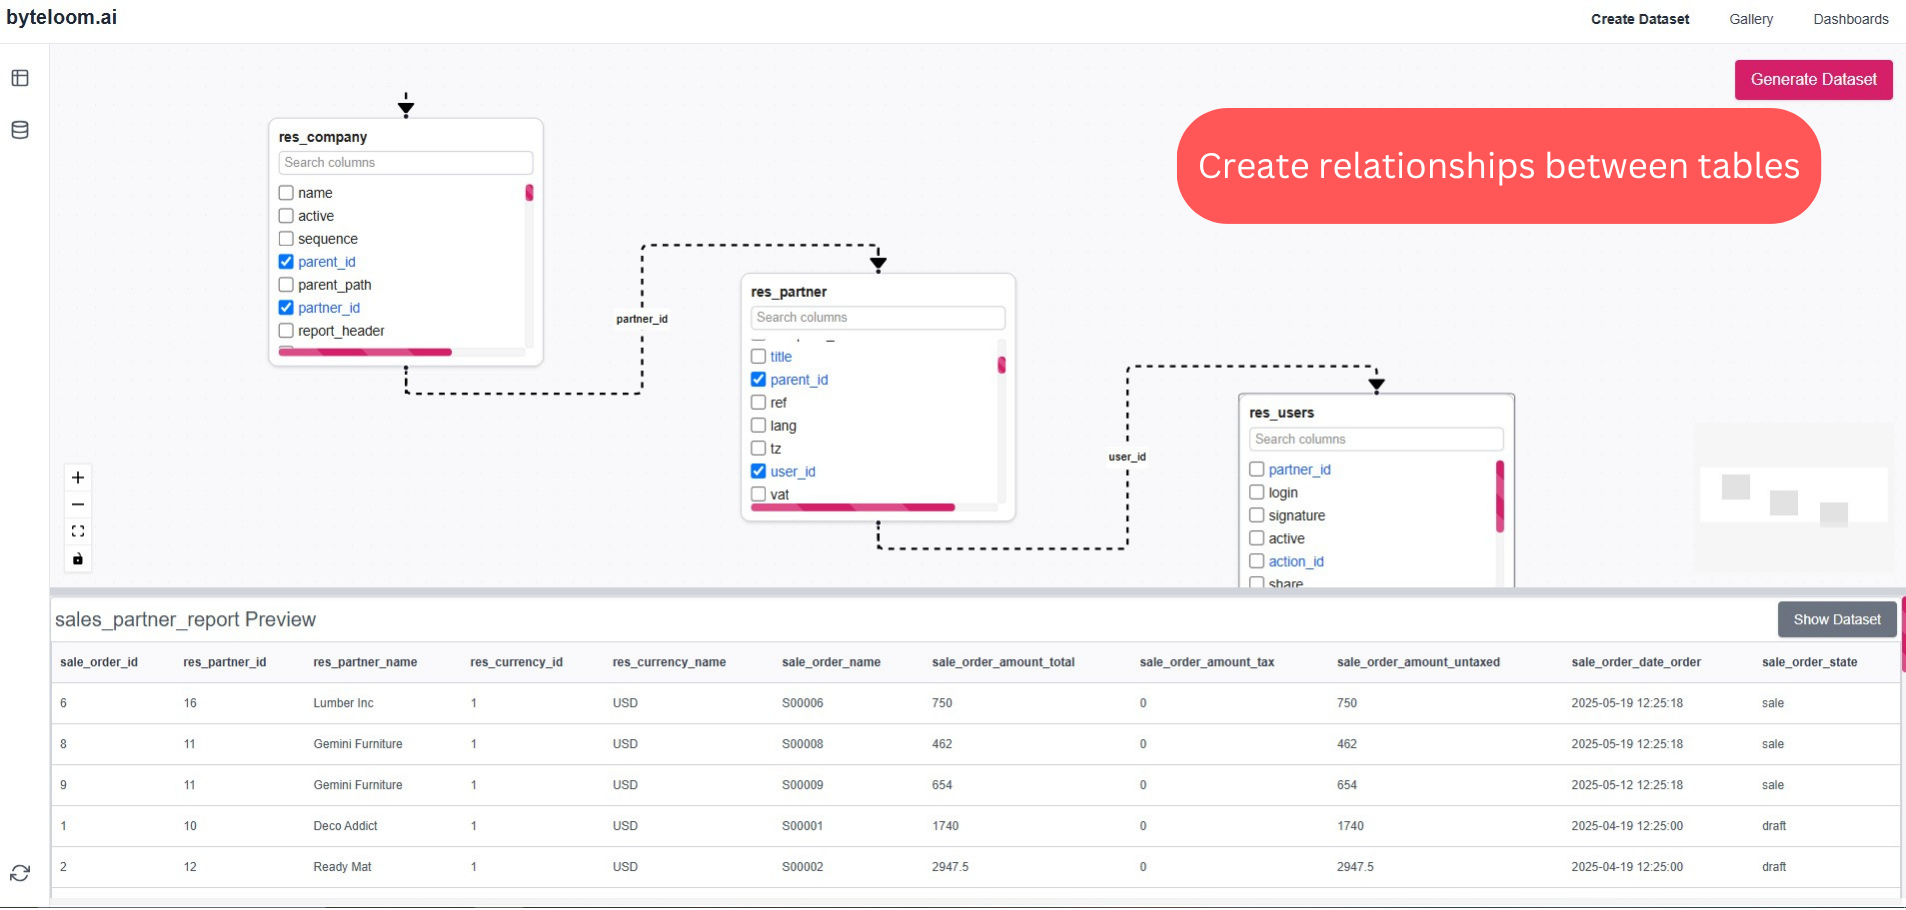
Create Relationships
Establish relationships between your selected tables to ensure proper data connections and meaningful chart generation.
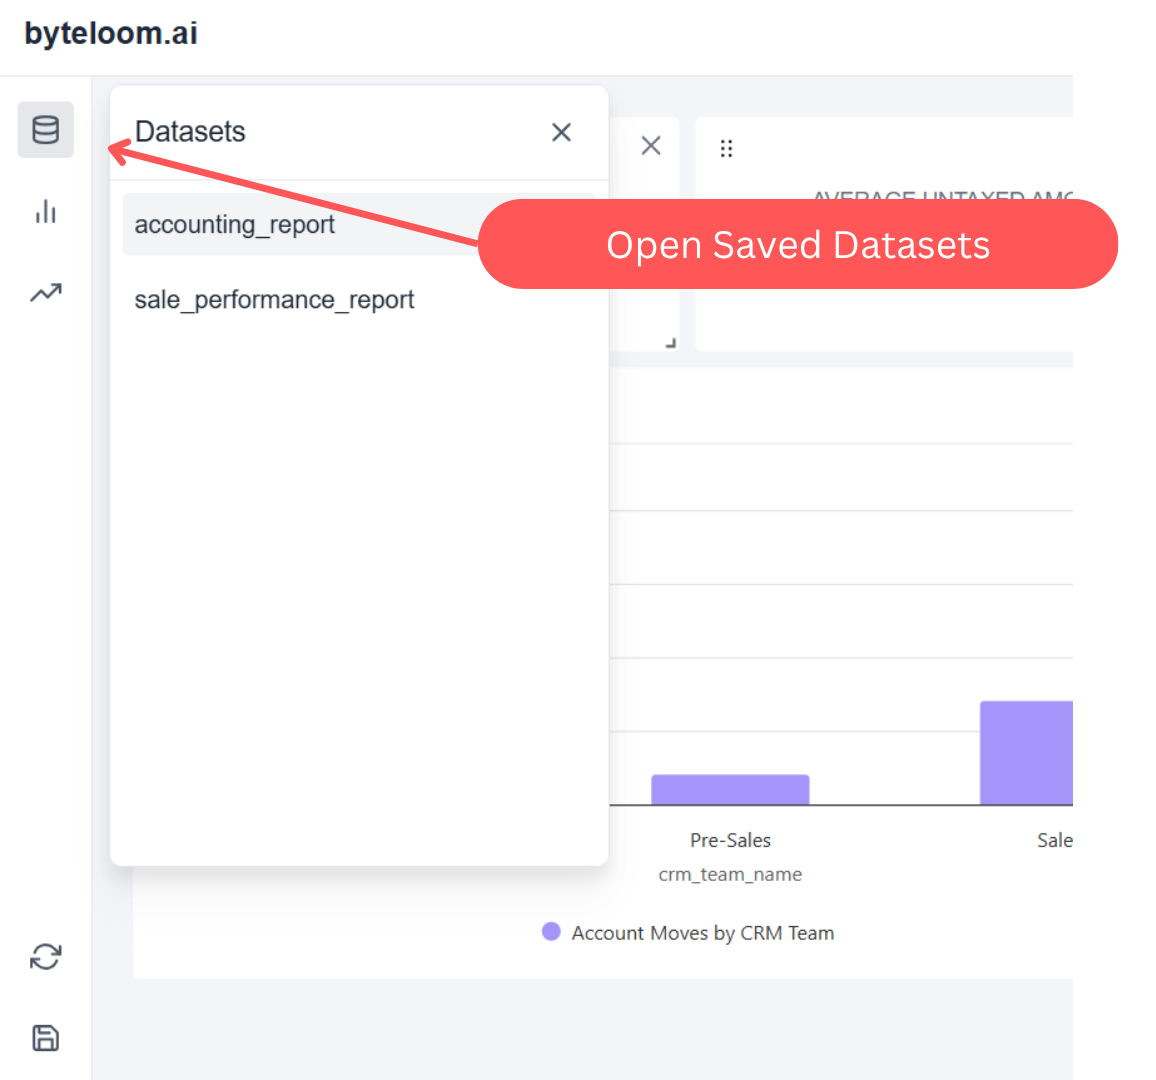
Additional Options
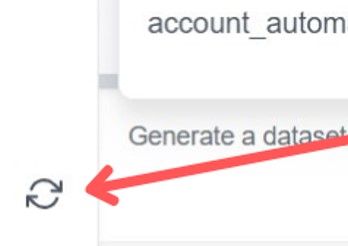
Open Saved Datasets
Load previously created datasets for modification
Reset Screen
Clear relationships and start over
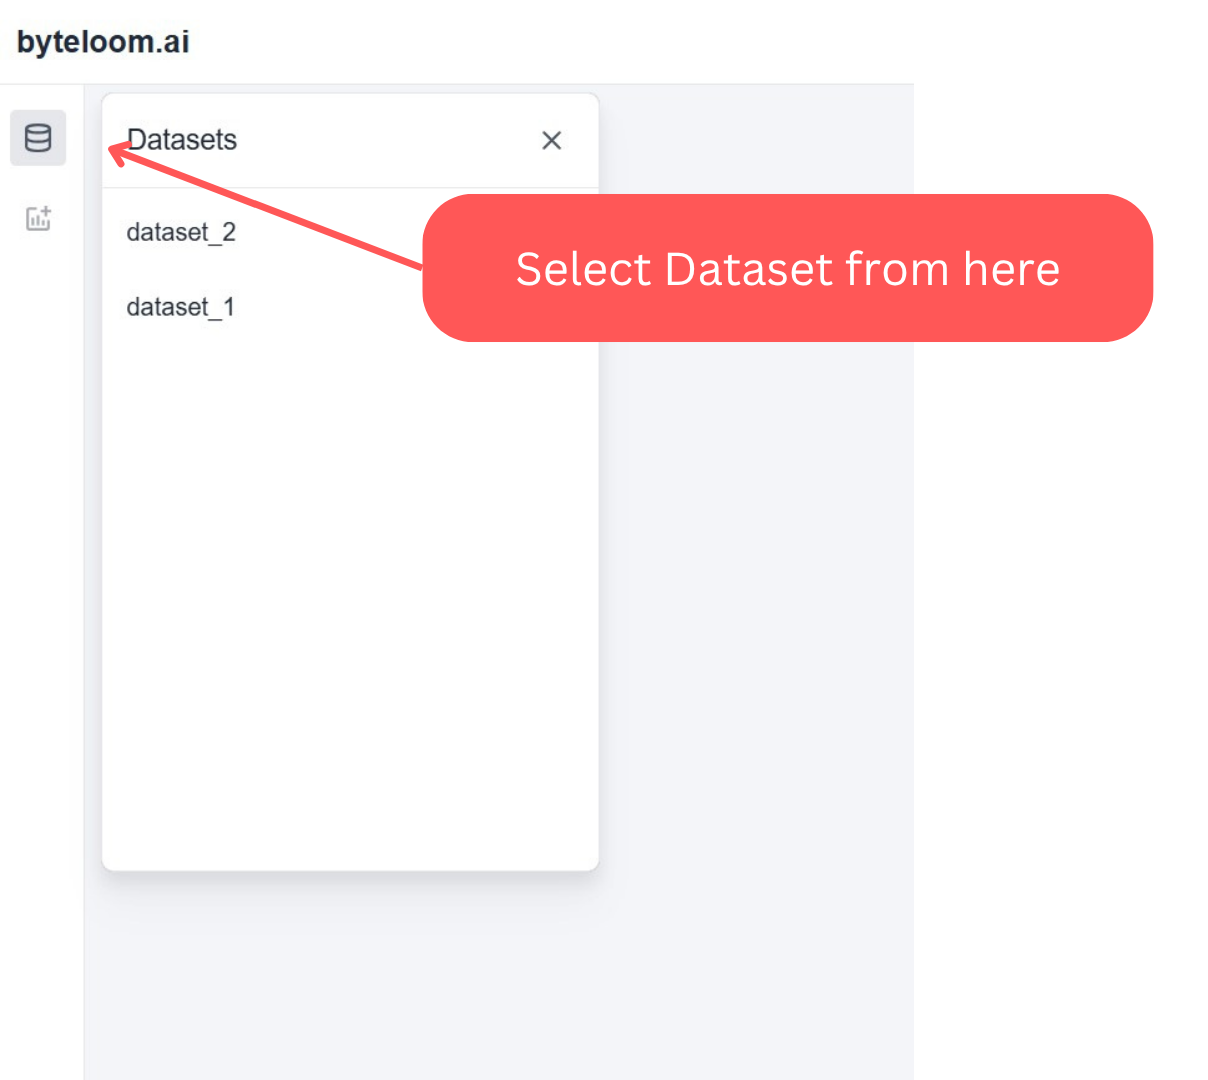
Gallery
The Gallery is where you can browse and select from your saved datasets to view all AI-generated charts and KPIs. Think of it as your visualization showcase.
Navigation Flow
Go to Gallery
Select Dataset
Load AI Charts & KPIs
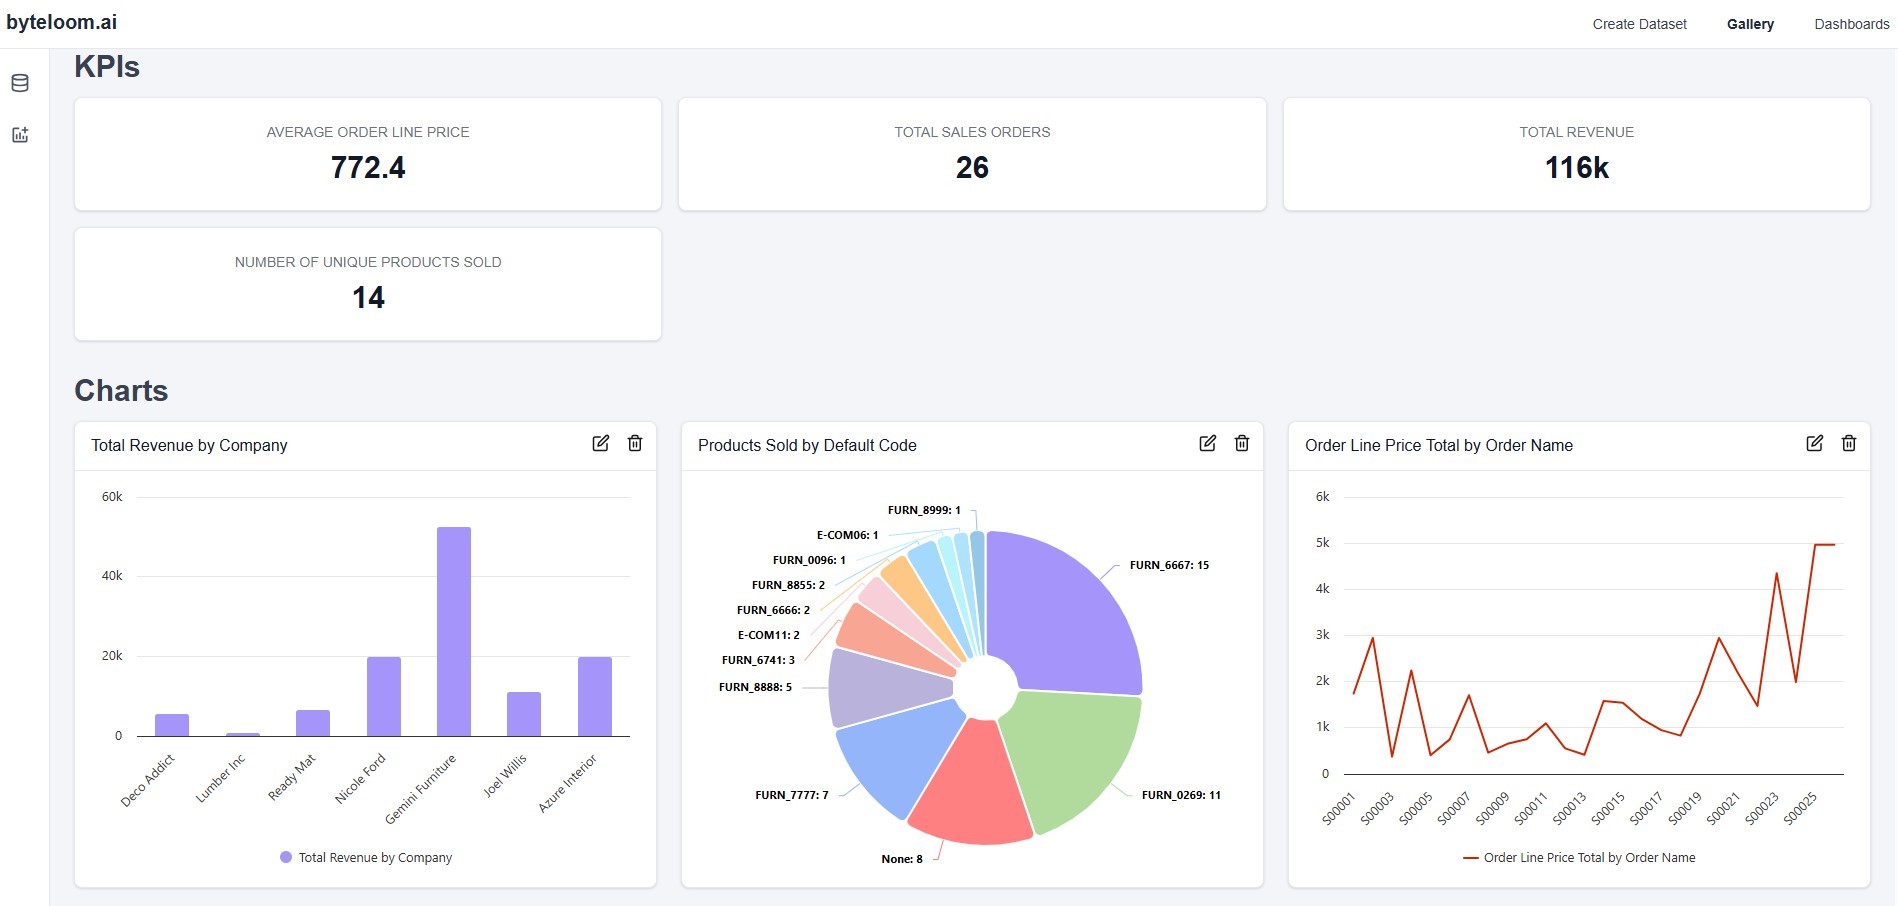
AI-Generated Content
View all charts and KPIs created by our advanced LLM model for the selected dataset.
- • Intelligent chart suggestions
- • Auto-generated KPIs
- • Data insights and trends
Edit/Delete Chart
Take control of your AI-generated charts with powerful editing tools. Modify chart properties, update data fields, or remove charts that no longer serve your needs.
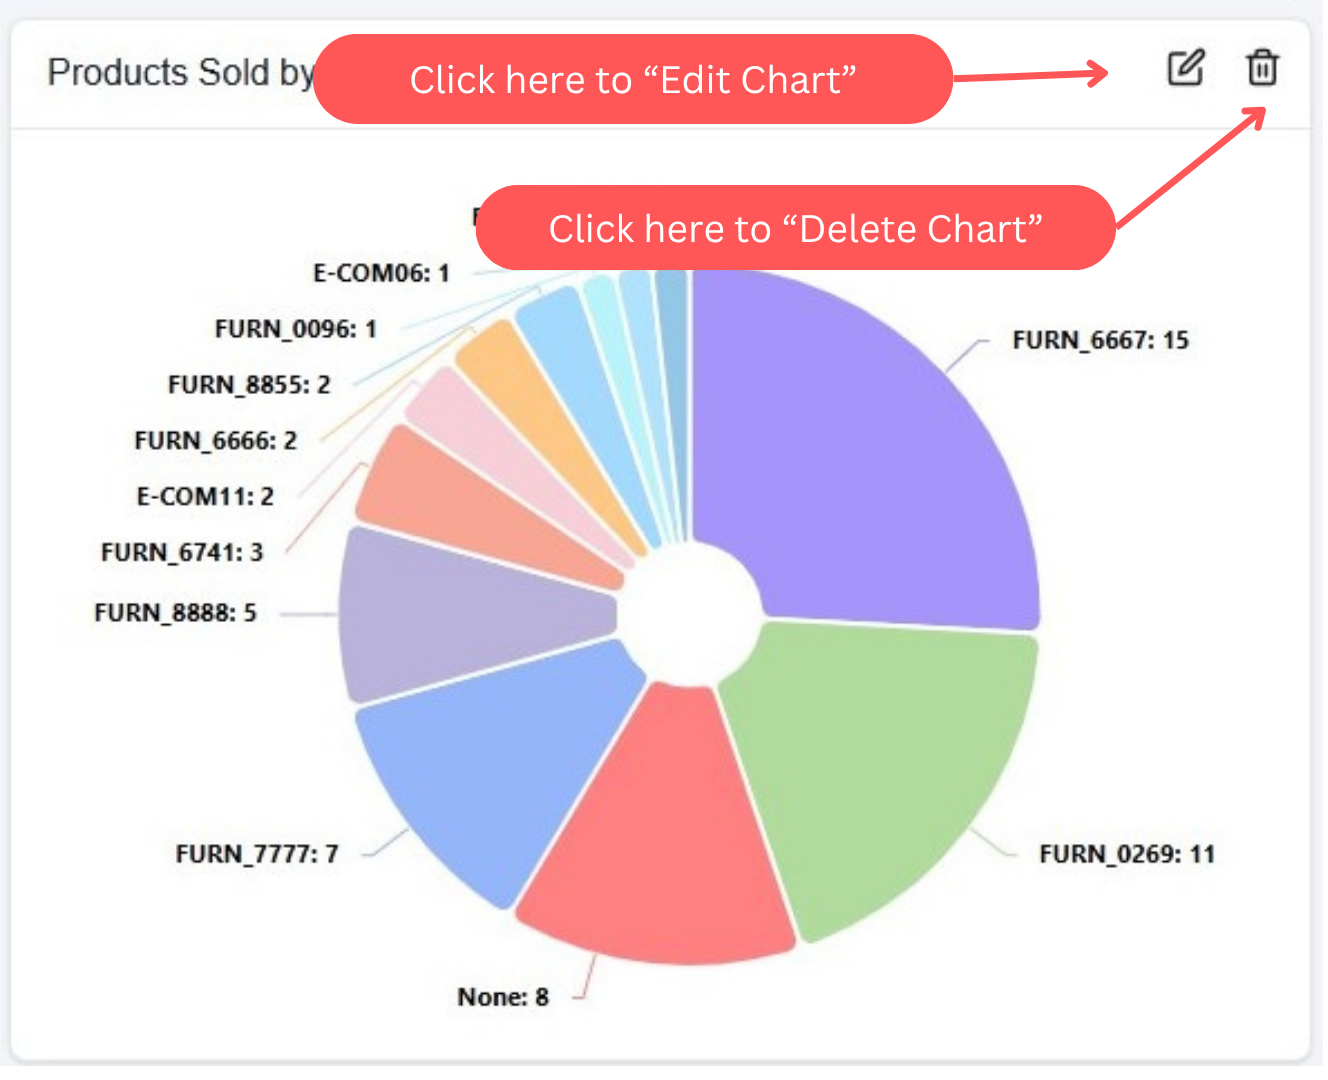
Edit Chart
Customize your AI-generated charts with advanced editing capabilities.
- Change chart types and styles
- Modify titles and aggragations functions
- Adjust x or y axis data fields
Delete Chart
Remove charts that no longer meet your requirements safely.
Warning: Deleted charts cannot be recovered. Consider duplicating before major changes.
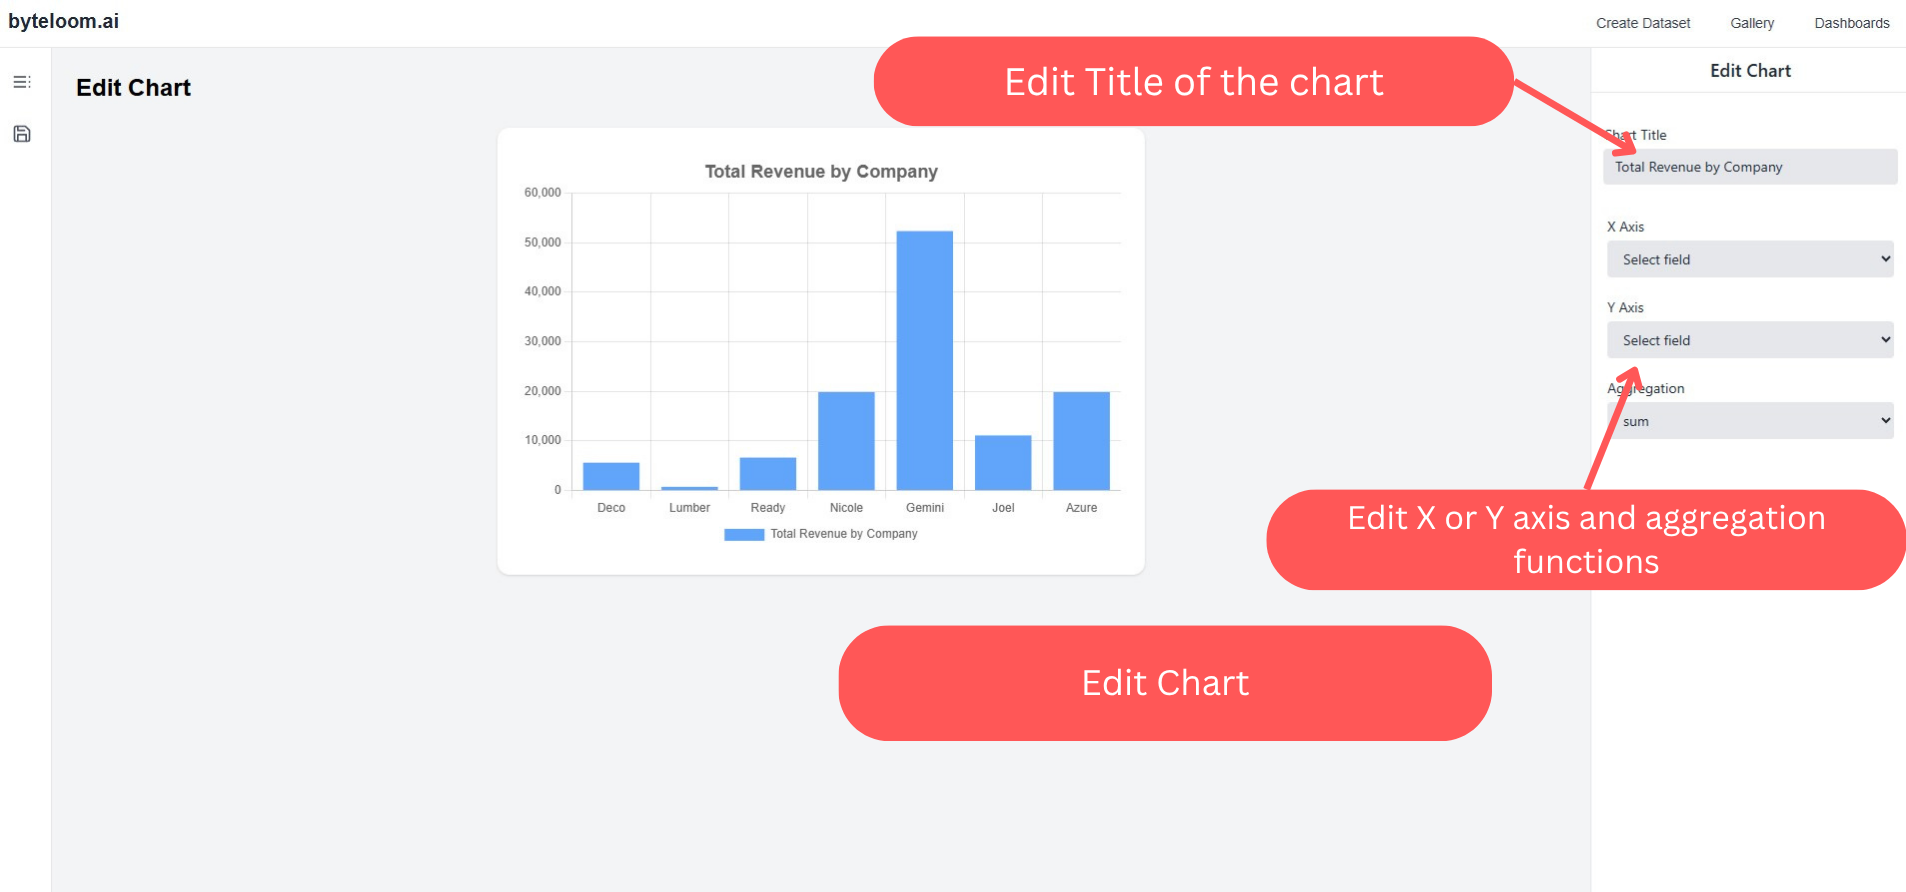
Edit Chart Screen
Access the comprehensive chart editing interface where you can fine-tune every aspect of your visualizations. Modify fields, apply aggregations, and customize the appearance to match your needs.
Editing Tools
X and Y Axis Modification
Change data sources and fields
Aggregation Functions
Apply sum, count, min, max
Visual Customization
Map type and title
Save Your Changes
After making your modifications, save the chart to preserve your changes and make it available in your dashboard builder.
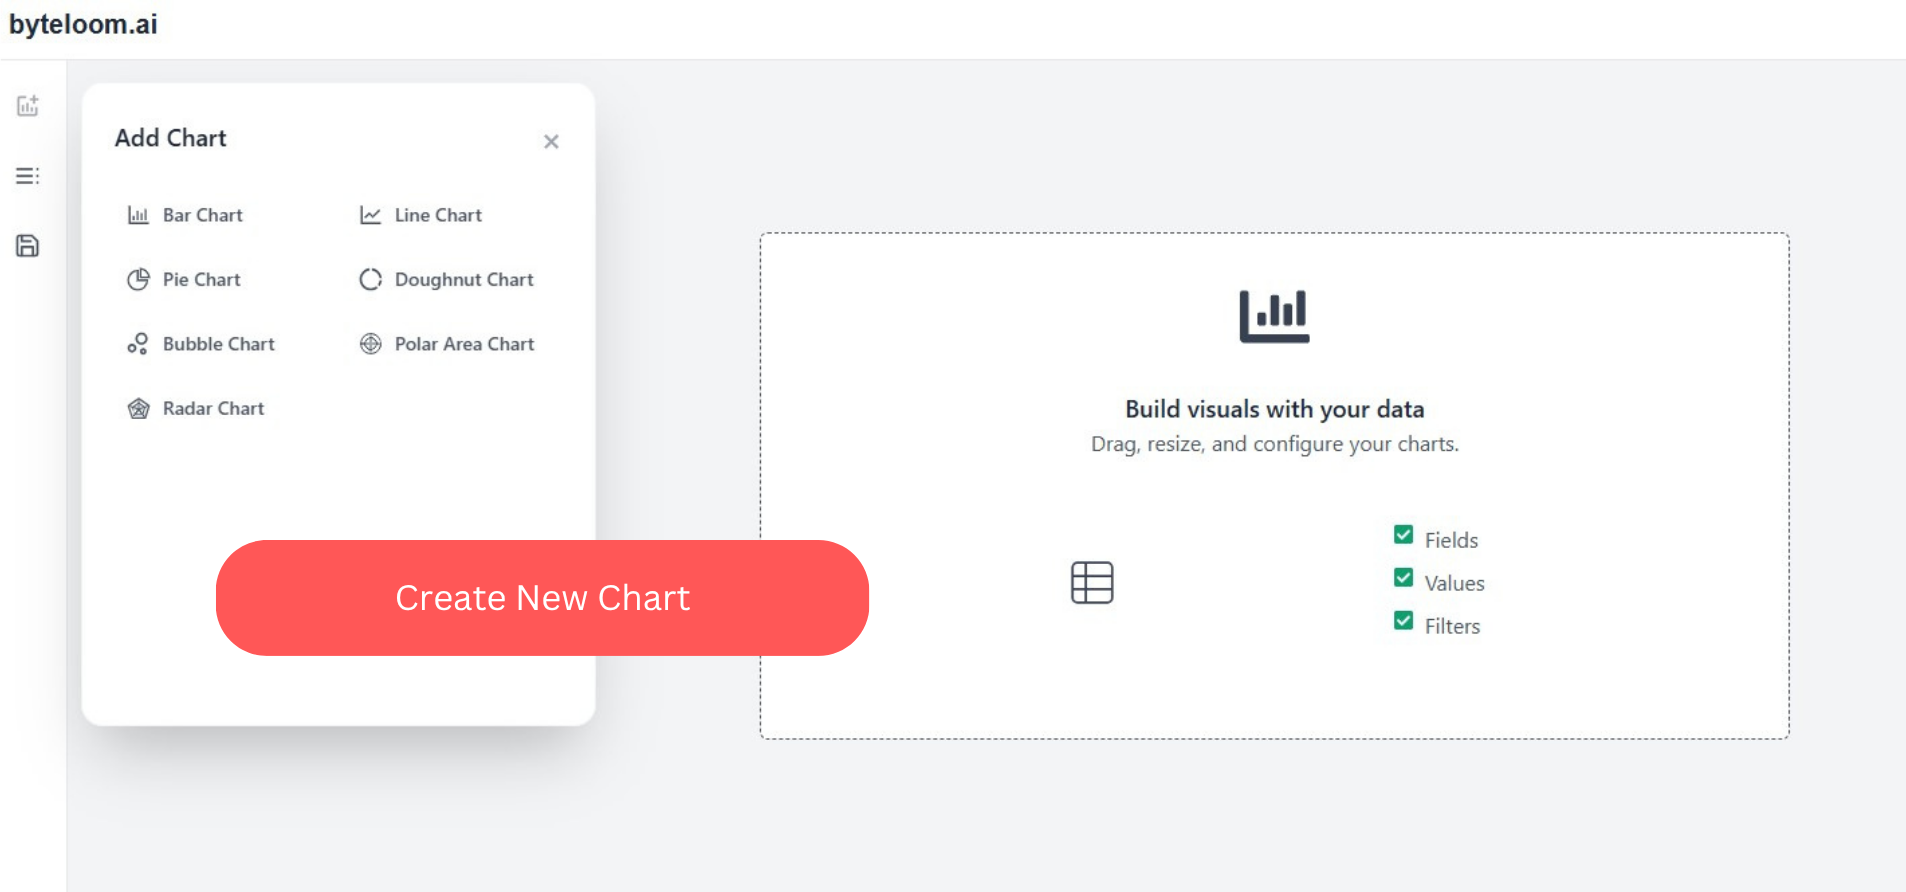
Add New Chart
Create custom charts from scratch using our intuitive chart builder. Choose from various chart types, select your data fields, and apply aggregation functions to build exactly what you need.
Available Chart Types
Bar Chart
Compare categories
Line Chart
Show trends over time
Pie Chart
Display proportions
+ Many more charts
Available Fields
Browse and select from all available fields in your dataset.
- • See all options for field selection
- • Select X and Y axis
- • Populate real time data
Aggregation Functions
Apply powerful aggregation functions to your data.
Create Dashboards
Bring everything together by creating comprehensive dashboards using your AI-generated charts and KPIs. Build interactive, shareable dashboards that provide valuable insights at a glance.
Dashboard Building Process
Select Dataset
Choose the dataset to fetch charts and KPIs from
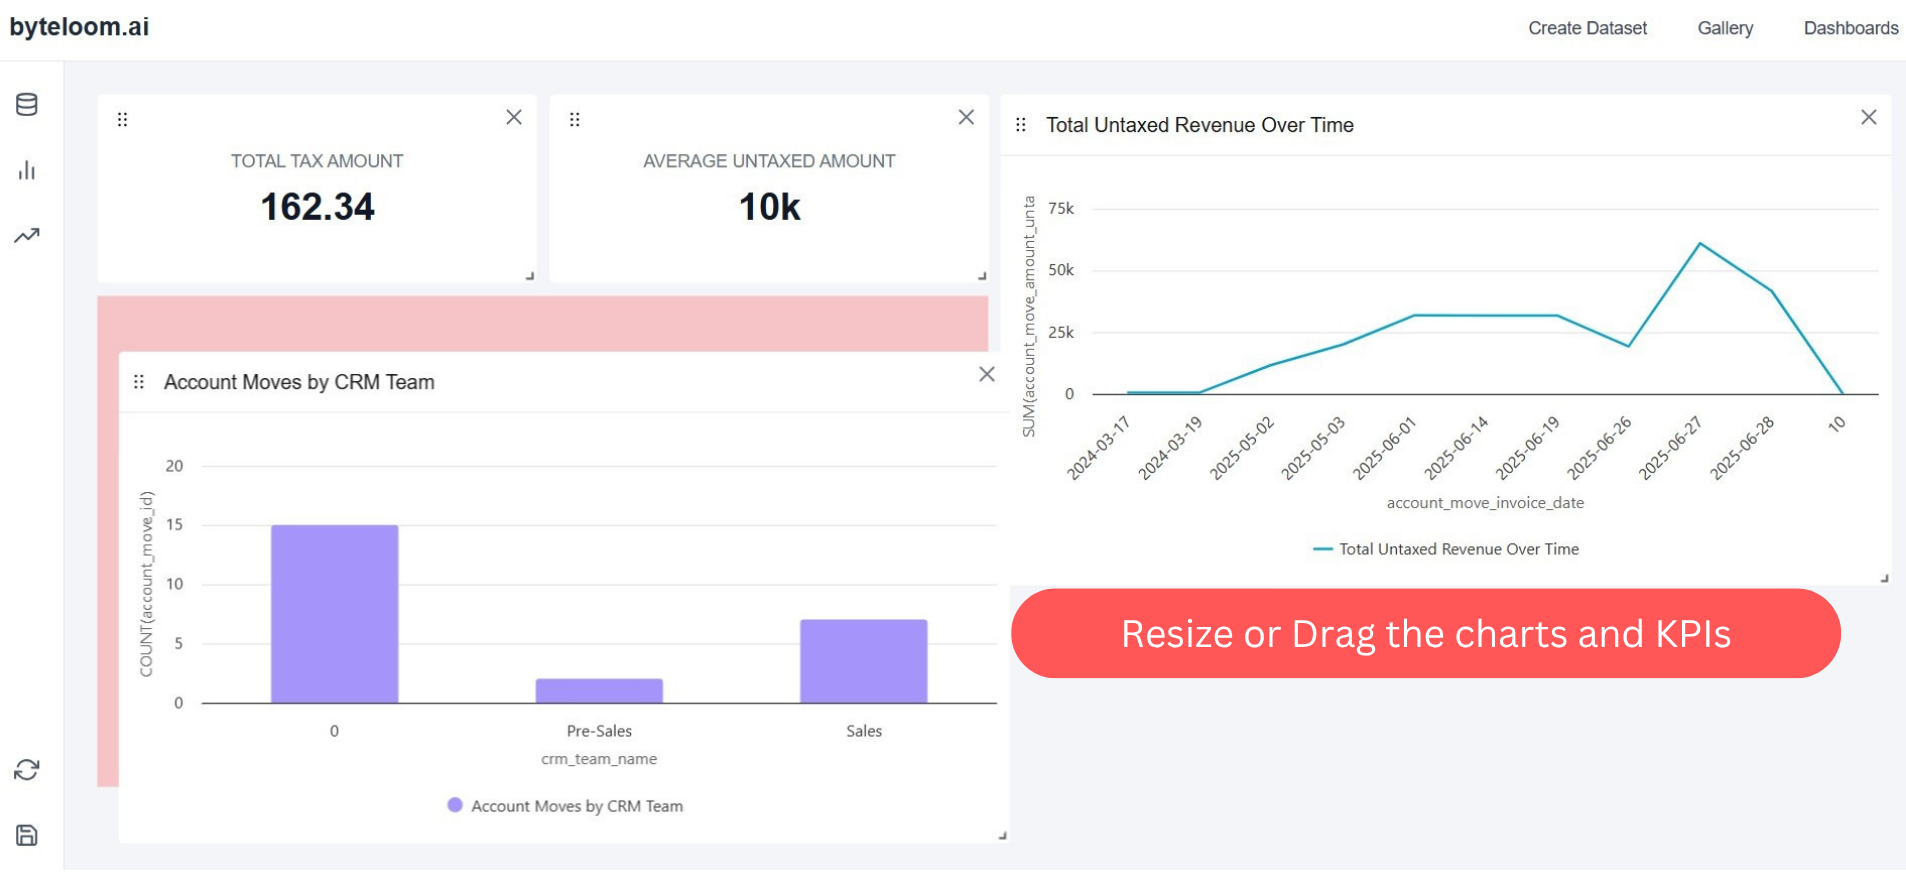
Drag & Drop Builder
Drag KPI cards, charts, and widgets to assemble your layout
Resize & Arrange
Freely resize and rearrange widgets to create the perfect layout
Save & Share
Save your dashboard and share it using the generated link
Flexible Layouts
- • Grid-based positioning
- • Responsive design
- • Custom widget sizes
- • Auto-arrange options
Sharing Options
- • Shareable URLs
- • Embed codes
- • Permission controls
- • Export options
Collaboration
- • Team access
- • Comment system
- • Version control
- • Real-time updates
Ready to Build Your Dashboard?
Start creating powerful, AI-driven dashboards for your Odoo data today.
Need Help?
Full Module Information
View detailed documentation and guides
Community
Join our active user community
Support
Direct technical support